Implement an observability's tracing in Rust with Sentry
Introduction
Observability means that the system’s state or status can be measured using logs, traces, and metrics. When the system has issues, observability makes it easier to understand the current system state and identify bugs.
The key components of observability are:
- Traces
- Logs
- Metrics
You can find more details about observability in Observability primer.
This time, we will focus on traces.
Trace and Span
A span represents a task or event, containing information about that task or event. A trace consists of one or more spans and shows the workflow of an entire process.

An example below is data of a span.
parent_id represents the parent span ID. If parent_id is empty, it means the span is a root span.attributes store custom data, such as function parameters.
{
  "name": "post-order",
  "context": {
    "trace_id": "0x5b8aa5a2d2c872e8321cf37308d69df2",
    "span_id": "0x93564f51e1abe1c2"
  },
  "parent_id": "0x051581bf3cb55c13",
  "start_time": "2022-04-29T18:52:58.114492Z",
  "end_time": "2022-04-29T18:52:58.114631Z",
  "attributes": {
    "http.route": "payment_route"
  },
  "events": [
    {
      "name": "check a payment",
      "timestamp": "2022-04-29T18:52:58.114561Z",
      "attributes": {
        "payment_id": 1
      }
    }
  ]
}
Implement tracing in Rust
tokio-rs/tracing provides tracing functions. You can find more information at https://github.com/tokio-rs/tracing?tab=readme-ov-file
First add dependencies.
# Cargo.toml
tracing = { version = "0.1", features = ["log"] }
tracing-subscriber = { version = "0.3", features = ["registry", "env-filter", "json"] }
sentry = {version = "0.34.0", features = ["tracing"] }
sentry-tracing = "0.34.0"
Then initialize tracing as follows:
# main.rs
// Register tracing
tracing_subscriber::registry()
        .with(
            tracing_subscriber::EnvFilter::try_from_default_env()
                .unwrap_or_else(|_| "DEBUG".into()),
        )
        .with(
            tracing_subscriber::fmt::layer(),
        )
        .with(sentry_tracing::layer()) // Sentry
        .init();

// Init sentry with tracing feature
let sentry_dsn = std::env::var("SENTRY_DSN").expect("SENTRY_DSN must be set");
let _guard: sentry::ClientInitGuard = sentry::init((
    sentry_dsn,
    sentry::ClientOptions {
        release: sentry::release_name!(),
        traces_sample_rate: 1.0,
        ..Default::default()
    },
));
The order system checks the name and price inputs, and if the price is negative, it returns an error.
The order system's workflow looks like

// Custom result
pub type Result<T, E = Error> = ::std::result::Result<T, E>;

// Custom error
#[derive(thiserror::Error, Debug)]
pub enum Error {
    #[error("an internal server error occurred")]
    InternalServerError,

    #[error("{0}")]
    UnprocessableEntity(String),
}

static TAX_RATE: f64 = 0.08;

#[derive(Debug)]
struct NewOrder {
    product_name: String,
    price: f64,
}

// Handler
#[instrument] <- this attribute makes span when the function is called
fn request_order_handler(new_order: NewOrder) -> Result<()> {
    tracing::info!("request_order_handler is called");

    match order_service(new_order) {
        Ok(_) => Ok(()),
        Err(e) => {
            tracing::error!("request_order_handler error: {}", e);
            Err(Error::InternalServerError)
        }
    }
}

#[derive(Debug)]
struct NewOrderEntity {
    product_name: String,
    total_price: f64,
}

// Service
#[instrument]
fn order_service(new_order: NewOrder) -> Result<()> {
    tracing::info!("order_service is called");

    let price = new_order.price * (1.0 + TAX_RATE);
    let new_order_entity = NewOrderEntity {
        product_name: new_order.product_name,
        total_price: price,
    };

    match order_repository(new_order_entity) {
        Ok(_) => Ok(()),
        Err(e) => {
            tracing::error!("order_service error: {}", e);
            Err(Error::UnprocessableEntity(format!(
                "order_service error: {}",
                e
            )))
        }
    }
}

// Repository
#[instrument]
fn order_repository(new_order_entity: NewOrderEntity) -> Result<()> {
    tracing::info!("order_repository called");

    if new_order_entity.total_price.is_sign_negative() {
        tracing::error!("total_price is negative");
        return Err(Error::UnprocessableEntity(
            "total_price is negative".to_string(),
        ));
    }

    // Store data into database

    Ok(())
}
Then if execute this process with params below, we can see logs
NewOrder {
    product_name: "Rust for rustaceans".to_string(),
    price: -58.0,
};

The log shows more detail for each spans.
You may notice that each functions has #[instrument] attribute, this create a new span when the instrumented function is called. The created span contains current event context so each span has relationships to each other.
Check trace in Sentry
There are new issues in Sentry.
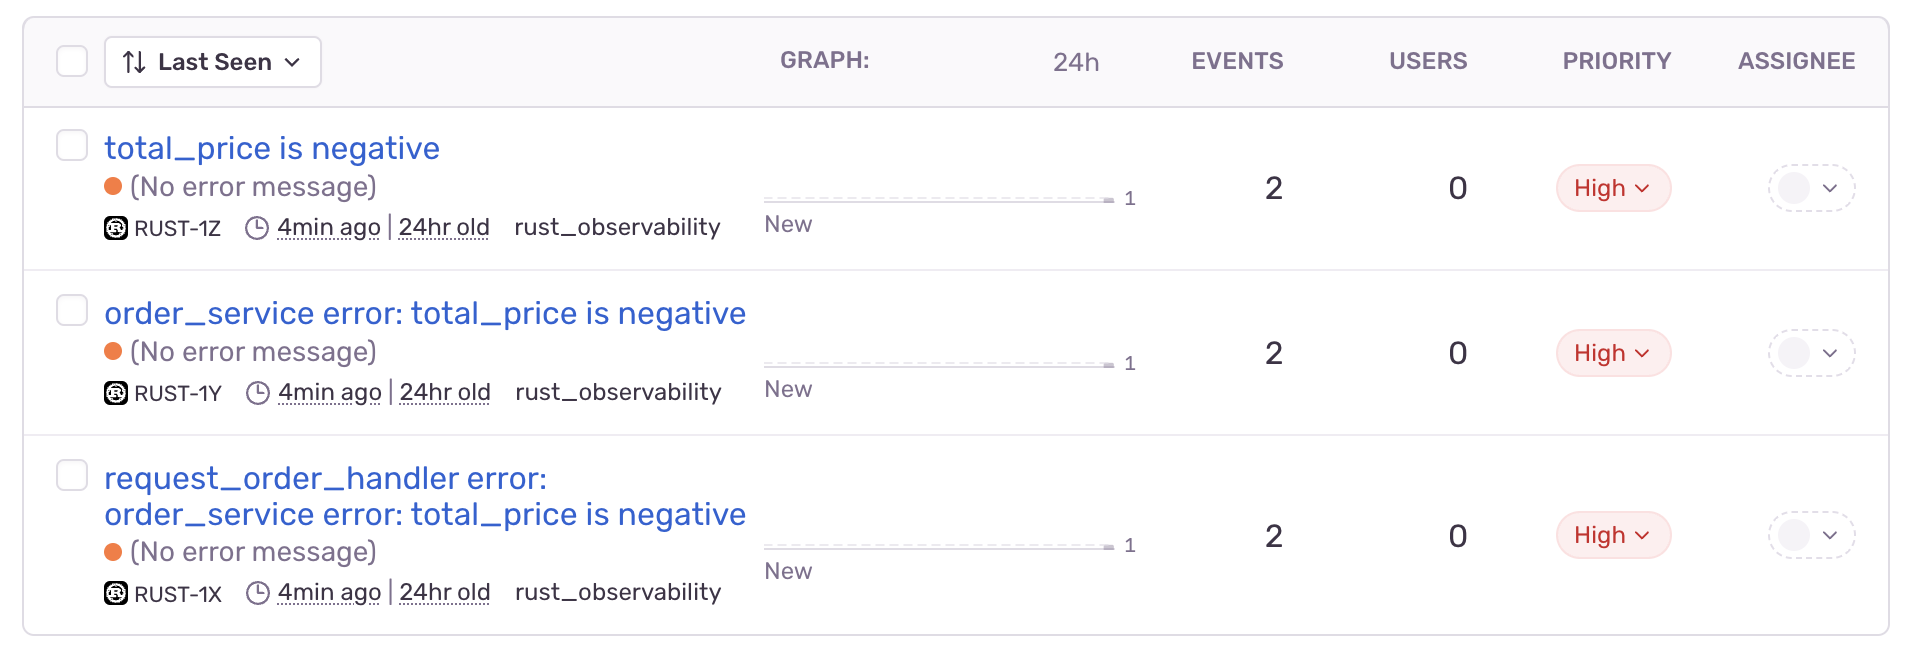
The each issue have same Trace ID.
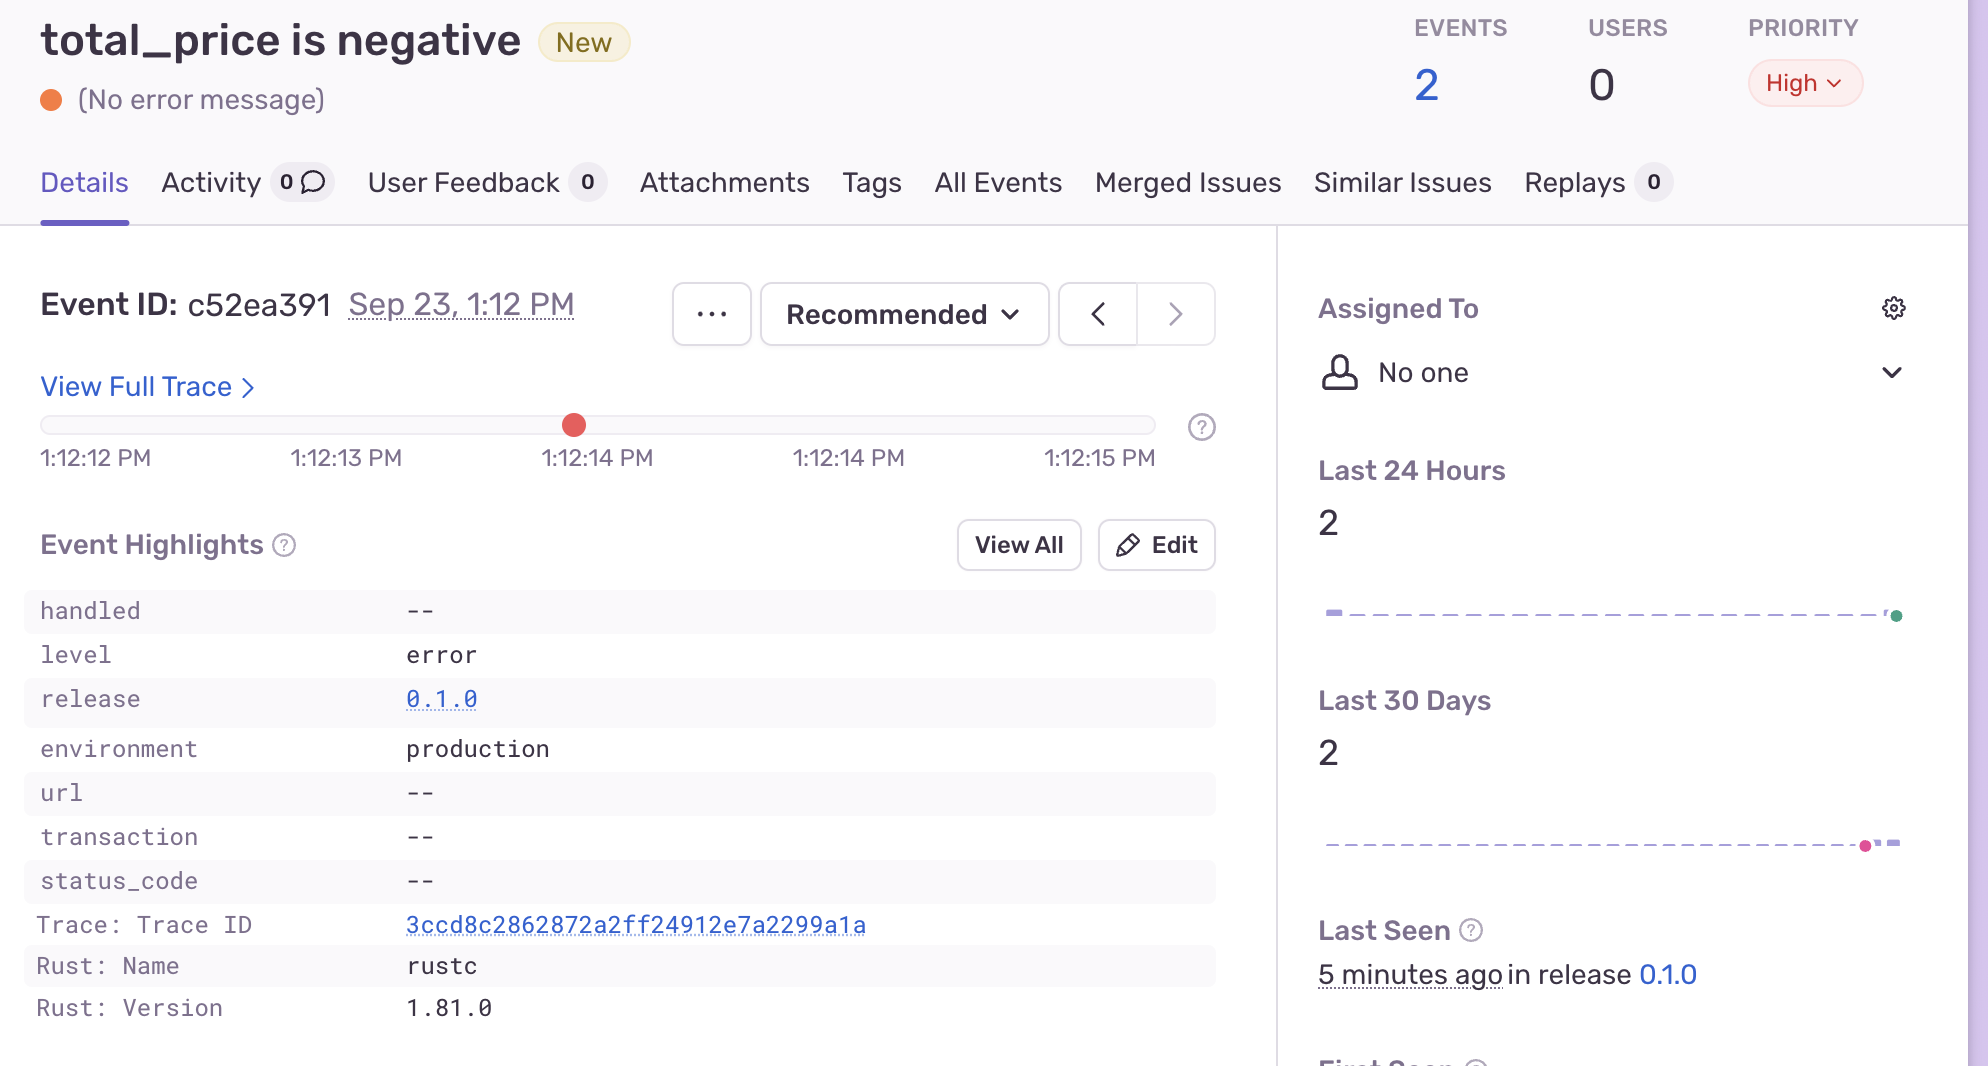
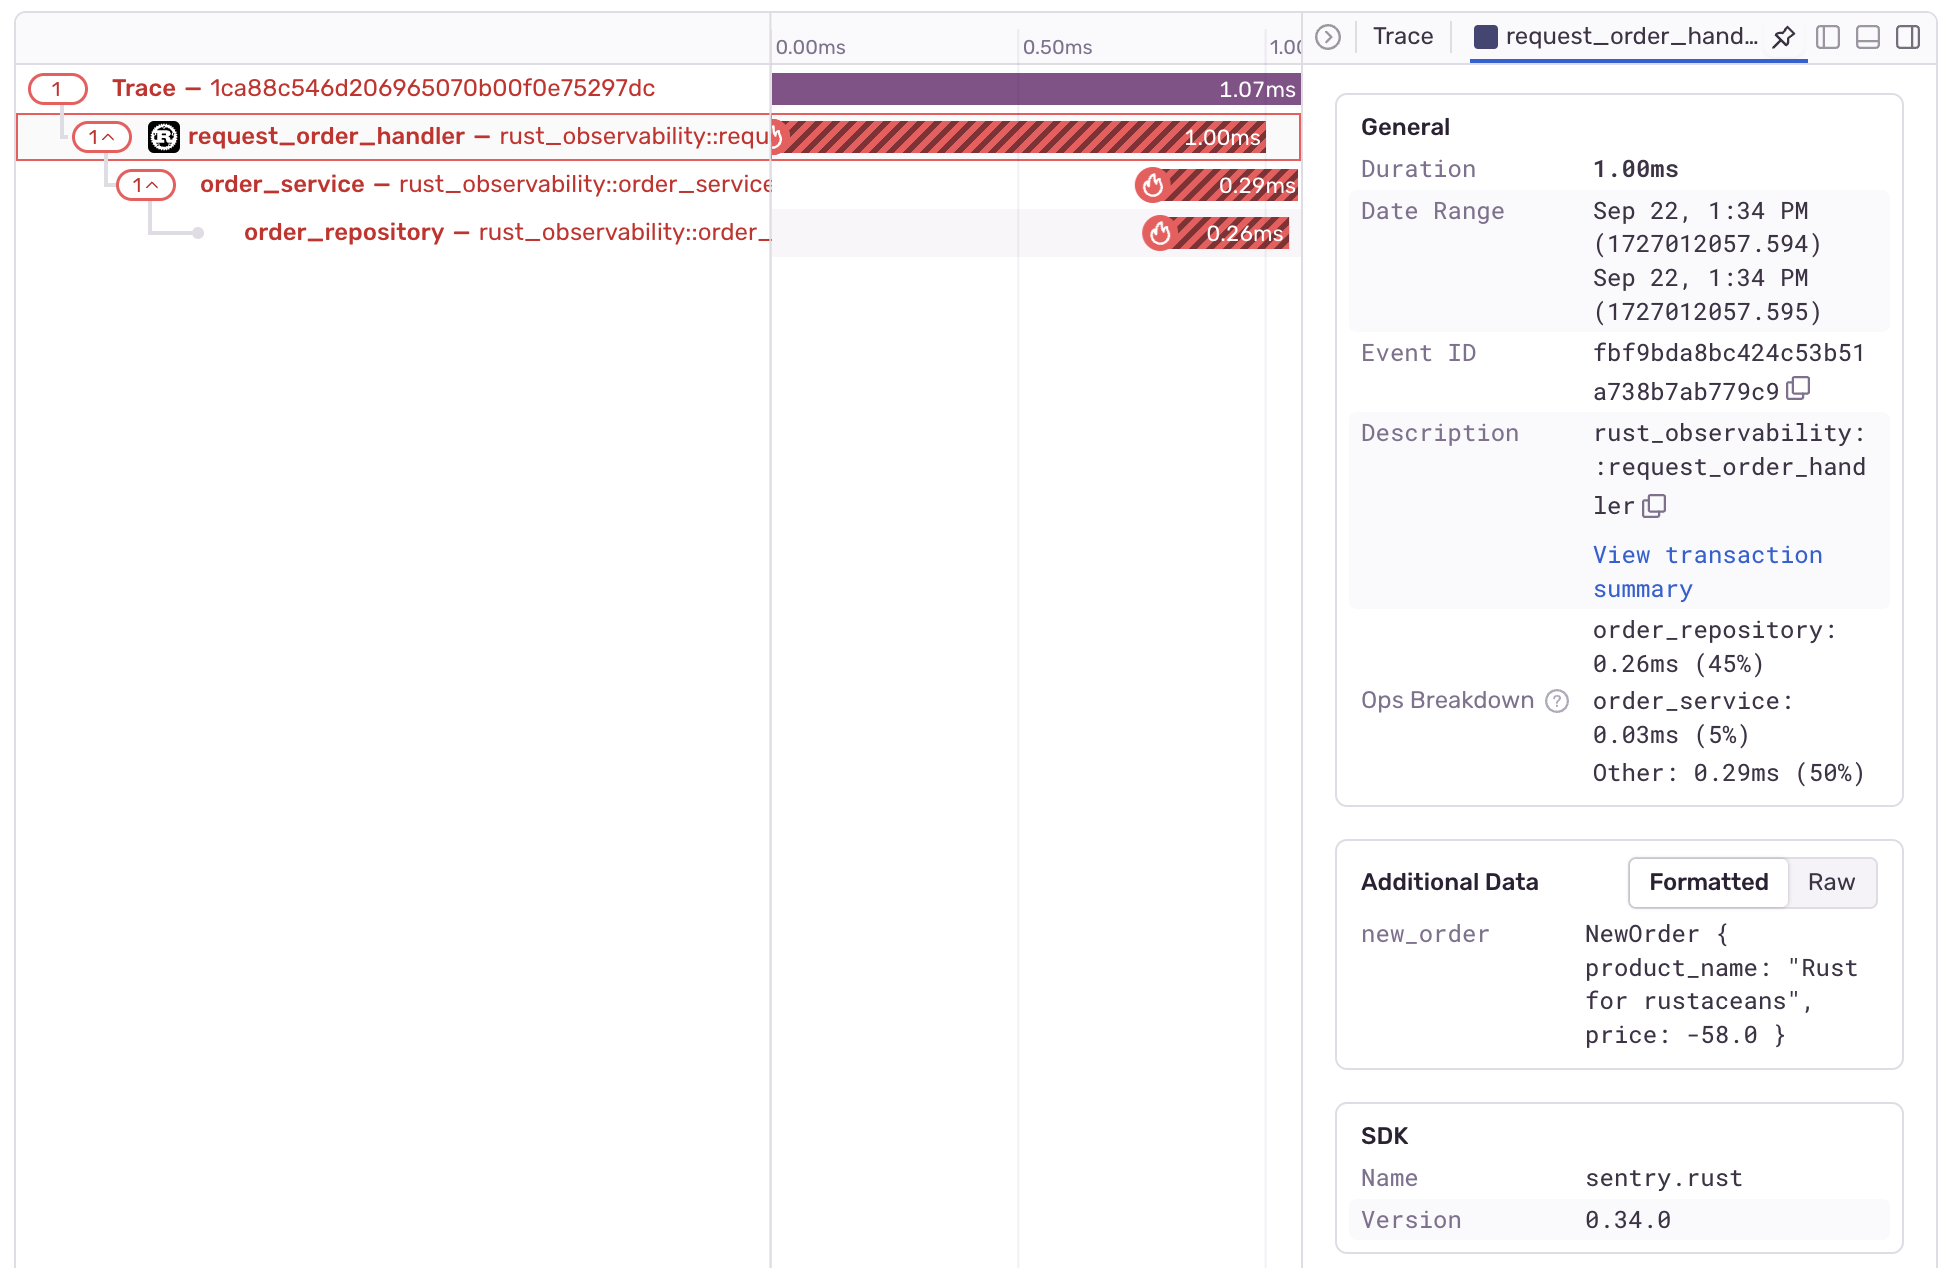
We can check overview of the trace from Trace menu.
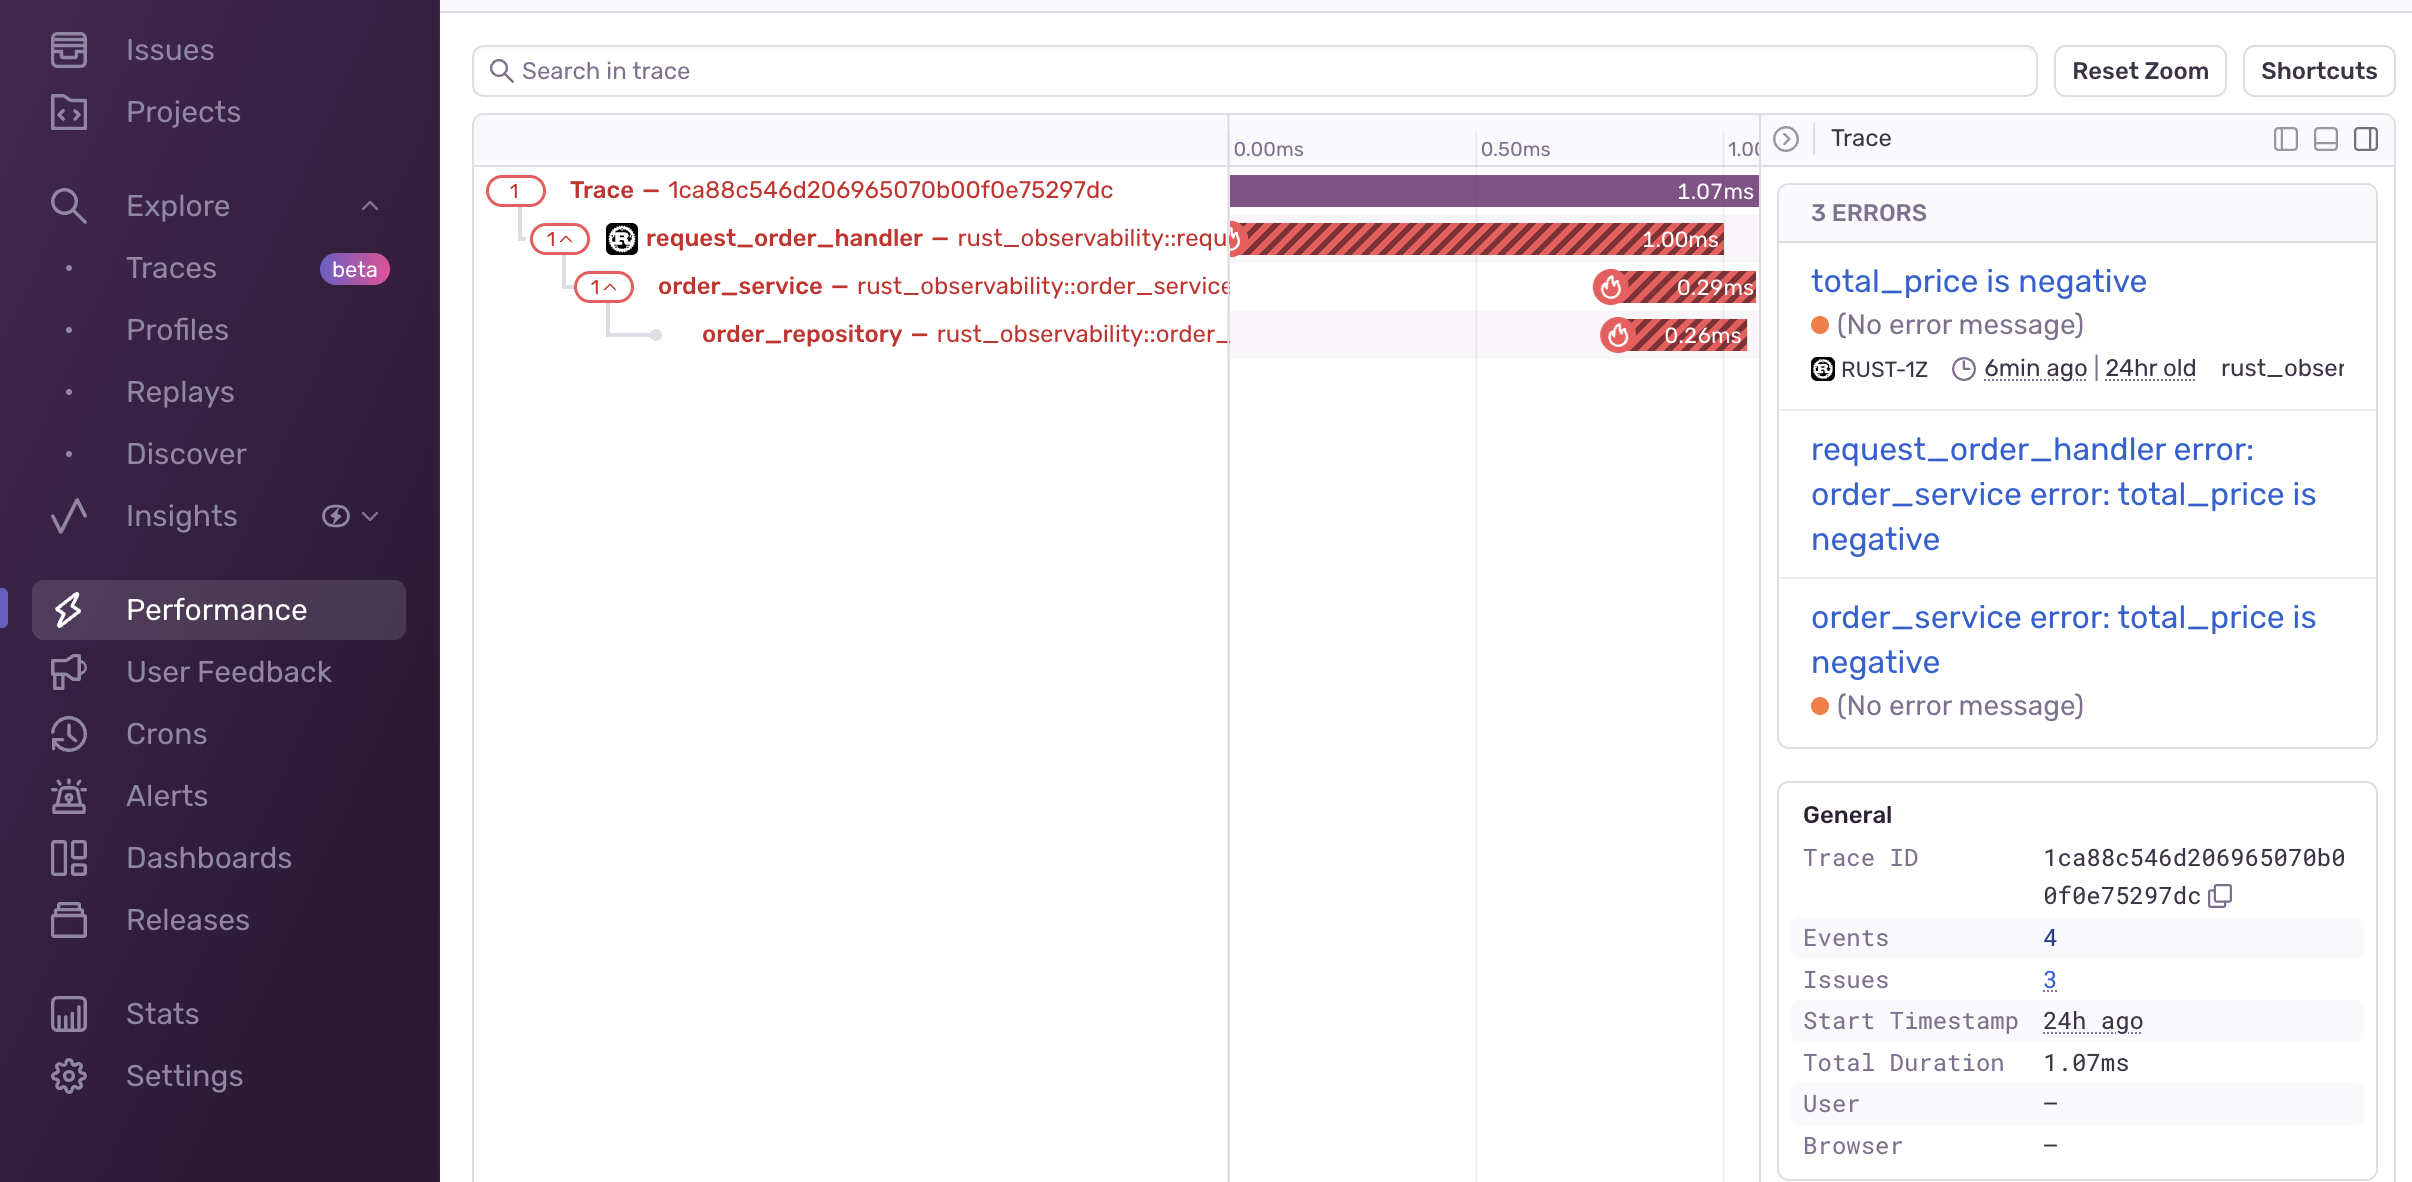
We can check more detail by clicking an issue and shows span data at right side of screen.
Conclusion
Observability gives you the ability to check the system's status.
When something goes wrong with the system, tracing can speed up the process of identifying the cause of the bug.
